You are likely here because you want to learn about Ecosuite’s Expected energy calculations. If so, that’s great because this post explains how we provide accurate Expected energy values for any particular Project, Site, System or array specific configuration. If you are new to any of these terms, please review Ecosuite’s terminology documentation.

At a high level, the Expected energy generation for any particular System is simply a function of the Irradiance data (i.e. intensity of sunlight hitting the panels), multiplied by the total area of the panels and the efficiency of the panels multiplied by the overall efficiency of the rest of the infrastructure in turning that output into useful electrical AC energy (commonly known as Performance Ratio). This calculated Expected energy value should closely match the Actual energy production of the system if everything is physically working as expected.
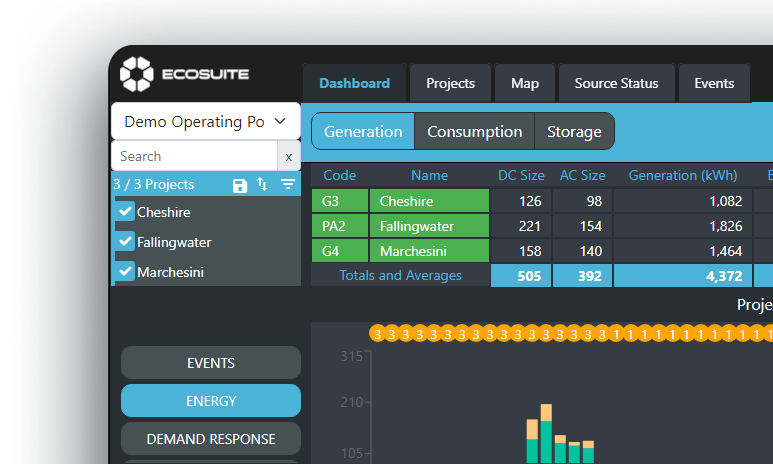
Sometimes it is also important to take clipping into account. One needs to be aware of clipping in some System designs – specifically where the DC size of the array is larger than the AC size of the array (i.e. when more DC electrical energy is likely going to be produced at some times during the year compared to the output capabilities of the AC inverters). When this happens, it is known as clipping and you are likely to see a flat top on the solar energy production curves during the middle of the day. Note that this is not a problem in itself, in fact it is a common situation with many system designs and it helps to maximise return on investment.
The problem with real world clipping though, is that many irradiance driven Expected calculations do not take clipping into account. This can lead to Expected energy graphs exceeding the Actual energy production. To take clipping into account properly, one needs to appropriately “clip” the real time irradiance data or more specifically the irradiance driven DC energy part of the data flowing into the final Expected energy calculation. Ultimately this means that the irradiance data stream that is collected for each System to drive these Expected calculations is no longer sufficient, one now also needs to collect a real time and system specific “clipped” irradiance data stream.
Note: This blog post is written to provide an easy high level introduction to the topic of Expected energy calculations. But it is a gateway to deeper knowledge! If you are here for the full details, please click this link and read our engineering team’s project onboarding documentation that explains how we do our expected energy calculation setup in full detail.
Once you have your Expected energy data stream configured and correctly taking clipping into account, assuming you have the correct settings for the the System’s Performance Ratio (PR), the only time you should see a deviation between Actual and Expected energy is when there is a fault or degradation in performance with one or more pieces of physical equipment that you have on site. When this happens, it is an indication to your asset managers that they may need to arrange an O&M visit to rectify the situation.


 Unlimited external users